Many organizations either skip measuring culture altogether or lean on a single annual survey, then act on whatever signal happens to be loudest that quarter. That's a costly habit. McKinsey found that healthy organizations deliver three times the total shareholder returns of unhealthy ones, regardless of industry.
This guide breaks down what you actually need to measure culture accurately in 2026, the methods worth using, how to read the results, and the mistakes that quietly sabotage most measurement efforts.
Key Takeaways
- Blend pulse surveys, personality/behavioral diagnostics, and people analytics — no single tool tells the whole story
- Align leadership on a definition of "desired culture" before you start measuring gaps
- Sort results into aligned, minor-gap, or fragmented bands, since each demands a different fix
- Skipping segmentation and skipping follow-up communication are the two most common survey failures
- Build measurement into a repeatable loop instead of a once-a-year audit
What You Need to Measure Organizational Culture in 2026
Picking the right tools matters less than picking them in the right order. Organizations that jump straight to a survey platform without a baseline often end up with data leaders don't trust and a report that collects dust.
Indicators and Tools Required
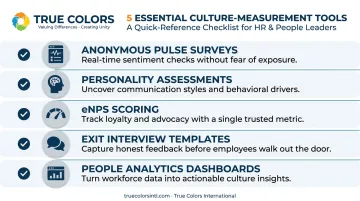
A workable culture-measurement toolkit typically includes:
- Anonymous pulse survey platforms for real-time sentiment tracking
- Validated personality/behavioral assessments to surface communication styles and collaboration friction
- eNPS scoring as a quick, directional loyalty signal
- Exit interview templates to capture the reasons people actually leave
- People analytics or HRIS dashboards for turnover, absenteeism, and mobility trends
None of these substitute for the others. eNPS, for instance, is a useful starting point, but Qualtrics itself warns that a single eNPS item is too simple to capture the full employee experience on its own.
Preconditions and Setup
Three things need to be in place before you collect a single data point:
- Confidentiality protocols. Report results only in groups large enough to protect anonymity (commonly five or more respondents). Without this, honest feedback dries up fast.
- Leadership alignment on "desired culture." If your executive team can't agree on what values should look like in practice, you'll be measuring a gap against a moving target.
- A segmentation plan. Break results out by department, tenure, location, and role. Subcultures form once you pass a few hundred employees or multiple sites; one company-wide average hides that story.
Methods to Measure Organizational Culture in 2026
Effective culture measurement blends quantitative breadth with qualitative depth. The right mix depends on company size, existing tools, and how much nuance you need.
Method 1: Employee Engagement and Pulse Surveys
Pulse surveys capture real-time sentiment on values awareness, trust, and satisfaction using Likert-scale items.
Tools needed: An anonymous survey platform and a standardized question bank. Items like "I understand the company's values" and "Leaders model our values" work well.
How to run it:
- Draft items that measure awareness, behavior, and consistency of stated values
- Distribute via anonymous, segmented links by team and location
- Benchmark scores against industry and regional data for context
Global engagement sat at just 20% in 2025, according to Gallup's State of the Global Workplace report, though regional figures swing widely (12% in Europe to 31% in the U.S. and Canada). Compare your numbers to the region your workforce actually sits in, not the global average.
Pros: Fast, scalable, easy to trend over time. Cons: Purely self-reported, and prone to survey fatigue if you send them too often.
Method 2: Personality and Behavioral Style Assessments
Surveys tell you that people are frustrated. They rarely tell you why. Personality and behavioral assessments diagnose how individual temperaments and communication styles clash across teams and leadership, often the root cause behind friction surveys can't fully explain.
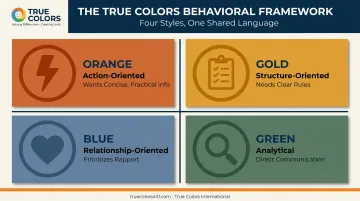
True Colors International's framework, used by organizations including Google, Ford, and Marriott, maps four behavioral styles:
- Orange: action-oriented, wants concise, practical information
- Gold: structure-oriented, needs clear expectations and rules
- Blue: relationship-oriented, prioritizes rapport before content
- Green: analytical, wants direct communication without emotional framing
How to run it:
- Administer the assessment across leadership and teams to map dominant styles
- Compare the aggregate style distribution against the collaboration values your organization claims to want
- Identify friction points (often pace, detail, tone, or decision speed) where clashing styles lack a shared language for resolving conflict
Pros: Excellent for diagnosing communication gaps and building a common vocabulary across teams. Cons: Not designed to track macro trends like turnover on its own; pair it with harder data.
Method 3: Focus Groups and Organizational Assessment Instruments
Focus groups and structured instruments add the qualitative layer surveys miss. Tools like the Organizational Culture Assessment Instrument (OCAI), built on Cameron and Quinn's Competing Values Framework, sort organizations into four archetypes: clan, adhocracy, market, and hierarchy. Scoring runs across six dimensions, including leadership style and organizational glue.
How to run it:
- Assemble a representative cross-section of employees across levels and functions
- Facilitate structured discussion comparing lived experience against stated values
- Score and distribute points across culture archetypes to visualize current versus desired state
Pros: Surfaces nuance surveys miss entirely. Cons: Time-intensive and hard to scale across a large, distributed workforce.
Method 4: People Analytics and Behavioral Data
This method mines existing HR data for objective, ongoing culture signals: turnover, absenteeism, recognition frequency, and internal mobility.
How to run it:
- Pull retention, absenteeism, and internal mobility data segmented by team
- Cross-reference it with survey and assessment scores to spot correlations
- Flag outlier teams or locations for deeper qualitative review
Gallup's meta-analysis of 3.35 million employees found top-quartile engaged teams had 78% lower absenteeism than bottom-quartile teams. Recognition data tells a similar story: a longitudinal Gallup and Workhuman study found employees who felt well recognized were 45% less likely to leave within two years.
Pros: Objective, continuous, less prone to response bias. Cons: Needs clean data infrastructure and doesn't explain the "why" without a qualitative layer.
How to Interpret the Results
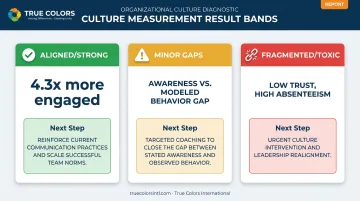
Misreading culture data is expensive. Leaders pour budget into the wrong fix, or miss early warning signs of disengagement until turnover spikes. Results fall into three bands.
Aligned or Strong Culture
Employees consistently report understanding values, seeing leaders model them, and seeing managers reinforce them day to day. That connection shows up in hard numbers.
According to Gallup's organizational culture research, culture-connected employees are:
- 4.3 times more likely to be engaged
- 62% less likely to report frequent burnout
- 5.2 times more likely to recommend their workplace
Next step: Reinforce through recognition programs and maintain with periodic pulse checks. Don't stop measuring just because the news is good.
Minor Gaps
Moderate misalignment usually shows up as a gap between what employees know about company values and what they actually see modeled by managers. This is the most common band, and the easiest to miss because scores don't look alarming on the surface.
Next step: Targeted manager training and clearer internal communication close this gap faster than another survey cycle will.
Fragmented or Toxic Signals
Low trust scores, high absenteeism, and sharply diverging subculture data across teams point to something deeper than a communication hiccup.
Next step: This calls for leadership-level realignment and a phased culture-rebuilding intervention, not a quick internal memo. Trying to message your way out of a fragmented culture rarely works.
Common Errors and Best Practices for Measuring Culture
Even well-funded culture programs stall when measurement design is weak. Spot the common traps first, then apply practices that keep data tied to action in 2026.
Common Measurement Errors
- Relying on one annual survey — real-time shifts between cycles go undetected
- Skipping segmentation — masks subculture problems that only show up at the team or location level
- Comparing scores with no external benchmark — an 80% satisfaction score means little without regional or industry context
- Never closing the loop with employees — collecting data without sharing findings or actions erodes trust for the next survey cycle
Best Practices for 2026
- Pair surveys with diagnostics — combine dashboards with personality-based tools to capture both the "what" and the "why"
- Use validated instruments — ASI certification against the EEOC 80% guideline confirms reliability and reduces disparate-impact risk
- Run continuous, small-cycle measurement — quarterly pulses plus an annual census, not a one-off audit
- Build a repeatable loop — Awareness → Alignment → Action → Reinforcement so every cycle drives action instead of sitting in a slide deck nobody opens
Conclusion
Accurate, multi-method culture measurement is not an annual HR checkbox you clear and forget. It only works when it is continuous, segmented, benchmarked against real data, and tied to a concrete next step.
You do not need to build that system alone. True Colors International has spent over 45 years helping organizations move from culture confusion to culture confidence—with a shared-language framework already used by teams at Google, Ford, and Marriott. Start by assessing how your people communicate and collaborate, then turn those insights into a culture action plan your leaders can run every quarter.
Frequently Asked Questions
How do you measure organizational culture?
Combine employee surveys, behavioral or personality diagnostics, focus groups, and people analytics data. Relying on any single method leaves significant blind spots in your picture of culture health.
What frameworks or dimensions are used to measure organizational culture?
Common options include the Competing Values Framework (OCAI archetypes), a values awareness-behavior-consistency model, and personality/temperament-based frameworks like True Colors. Each highlights a different dimension of culture.
How often should you measure organizational culture?
Run an annual census survey for baseline trends, plus quarterly pulse surveys to catch emerging issues between cycles. This cadence matches what most managers can realistically act on.
What's a good response rate for a culture survey?
Aim for a 60–80% response rate for reliable results. Clear communication about anonymity typically boosts participation.
Can you measure culture without formal employee surveys?
Yes. Turnover, absenteeism, recognition patterns, exit interviews, and personality/team assessments all provide useful signals. Surveys still add direct voice-of-employee context that behavioral data alone can't.
What's the difference between measuring culture and measuring engagement?
Engagement measures psychological commitment and readiness to perform. Culture measurement captures the shared values and behaviors that shape how work actually gets done day to day.